
Statistics in the Kaspi bot: reports and charts for your store
The “Statistics” section of the RebithReprice panel turns your store data into clear reports and charts: what sells, how orders are going and what repricing is doing. Decisions about prices and purchasing are made from numbers, not gut feeling.
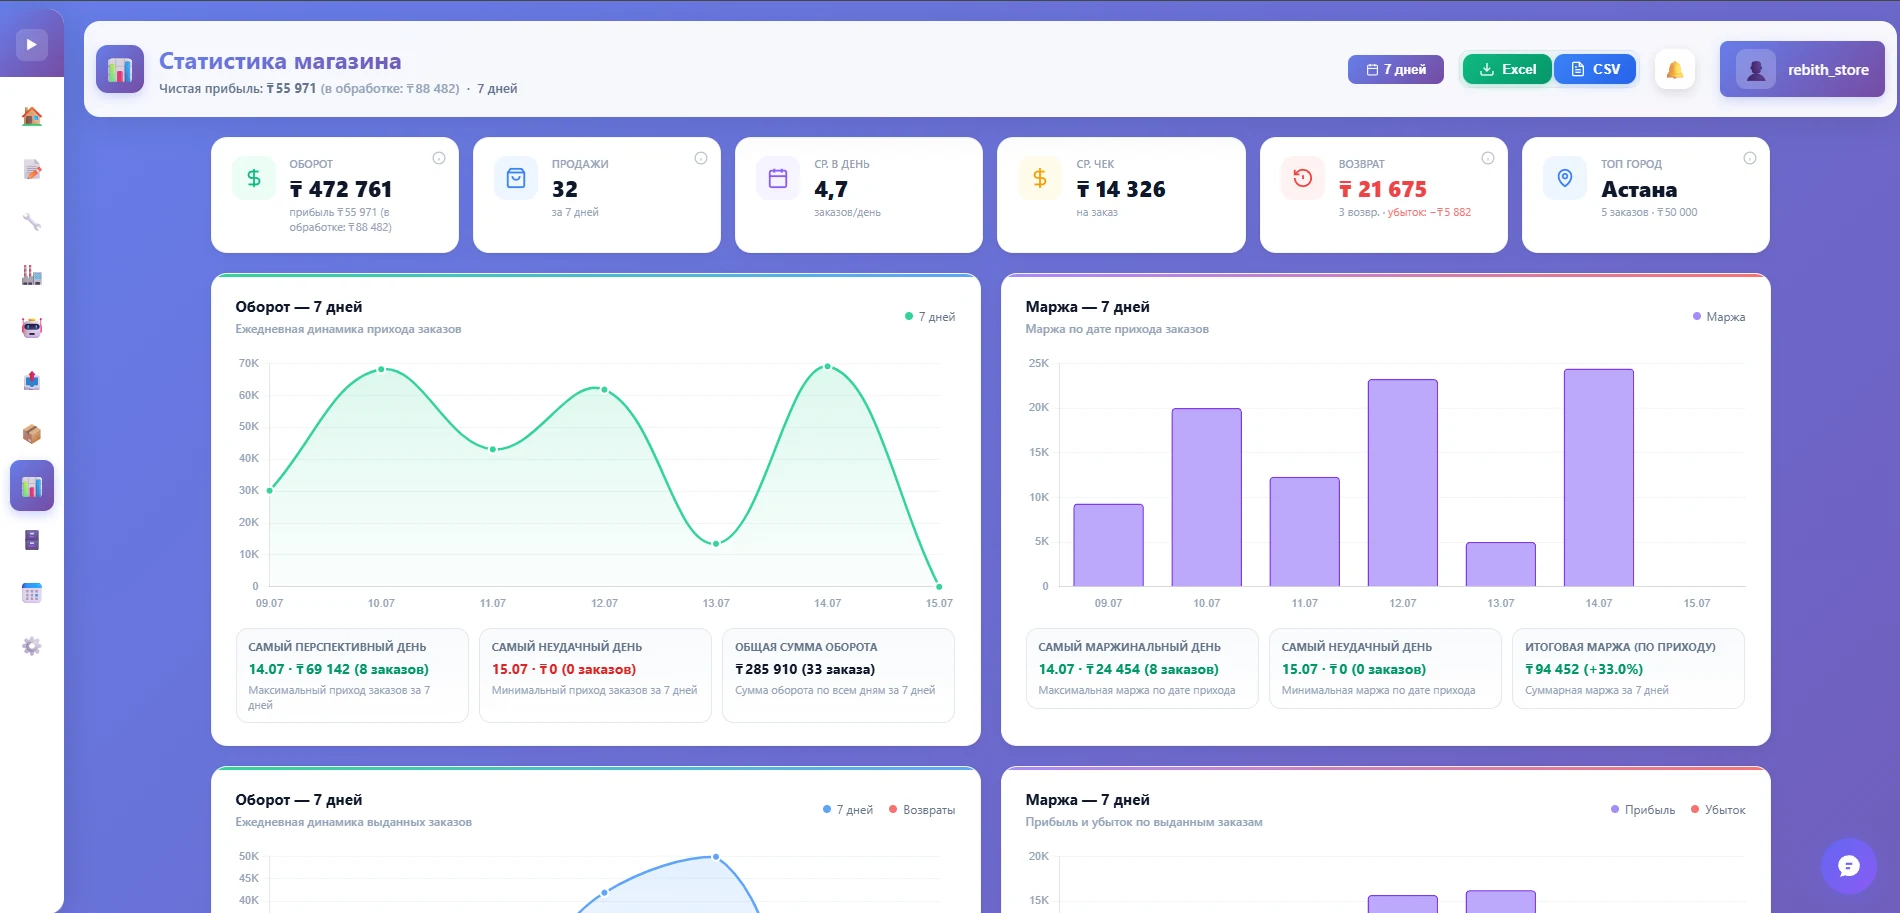
Why a seller needs statistics
While a store has a dozen products, you can keep the picture in your head. When there are hundreds of listings and prices change daily, it is easy to go wrong without numbers: keep investing in a product that barely sells, or underrate the one that brings most of the revenue.
Statistics in RebithReprice sits next to the other panel sections — prices, orders and warehouse — so you look at the numbers where you make decisions and don’t move data between spreadsheets.
What the “Statistics” section shows
Sales dynamics
Orders and revenue by period — you see whether sales are growing or dropping, and when it started.
Strong and weak products
Which items bring the main turnover and which sit untouched for months, taking up warehouse space.
Repricing results
How many prices the bot updated and how prices changed in listings — to judge what automatic repricing gives you.
Margin by order
You see which sales make money and which are close to break-even — before it becomes a habit.
How to use the numbers in your work
- Compare prices with sales. If orders grew after a price cut, the strategy works; if not, the cause may not be the price.
- Pick out the leaders. Products with the main turnover deserve a more careful minimum price and stock availability.
- Find dead stock. Items with no sales are a reason to revisit the price, description or purchasing.
- Watch the trend, not the day. One quiet day is no problem; a decline over several weeks is a signal to act.
Data updates itself
The RebithReprice bot runs on a separate server set up for your store and collects data in the background. No need to export reports from the Kaspi cabinet, assemble them in Excel and recalculate formulas: open “Statistics” and everything is already up to date.
Statistics, orders and warehouse together
Statistics is part of one panel. The orders list keeps Kaspi history, the warehouse tracks stock and takes sold-out items off sale, and repricing holds prices. The numbers in statistics are built from the same data, so there are no discrepancies between sections.
| Without statistics | With RebithReprice | |
|---|---|---|
| Where numbers come from | Exports and manual spreadsheets | The panel, automatically |
| Freshness | As of the last export | Updates itself |
| Time per report | Hours in a spreadsheet | Open the section |
| Link to prices | Must be matched by hand | In one panel |
AI analysis on top of statistics
If you’d rather not read charts yourself, the “AI analysis” section reviews your store metrics and suggests what to do first. More on the page AI analysis for your Kaspi store.
Who benefits most from statistics
- Stores with a large range. With hundreds of listings you cannot spot leaders and laggards by eye — charts do it for you.
- Those using repricing. Statistics shows how automatic price cuts affect orders and helps you choose minimum prices.
- Teams. When several people run the store, shared numbers in one panel replace arguments about “how things are going”.
Even if you work alone for now with few products, the habit of checking numbers once a week pays off: you notice a problem before it turns into lost profit.
How to connect
Sign up and connect your Kaspi.kz store in the panel with your seller ID and API token. The “Statistics” module is not in every plan: what your plan includes is shown in your cabinet and on the page pricingpage. If you need help connecting — message us, the WhatsApp link is on the contacts page.
Frequently asked questions
What does the “Statistics” section show?
Reports and charts for your store: order and sales dynamics, repricing results and other metrics. The set of reports may grow — the current ones are shown in the panel.
Do I need to export data manually?
No. The bot runs on a separate server and collects the data itself, so charts update without Excel exports or manual reports.
Is statistics included in every plan?
Statistics is a separate panel module, and the feature set depends on the plan. What your plan includes is shown in your cabinet and on the pricing page; the module can be added separately.
Can I try it for free?
Yes, there's a free trial period: pay only after you're sure the bot works on your products.
Try it for free
Registration takes a minute. Pay only after you're sure the bot works on your products.
Sign up →